In this article, you'll learn how to follow your review requests from the first text all the way to a new Google review, using the Reviews report. It's the quickest way to see whether people are getting your messages, which message gets them to click, and where they drop off.
To open the Reviews report:
- In the dashboard menu, click Reports.
- Click Reviews.
Pick a view first
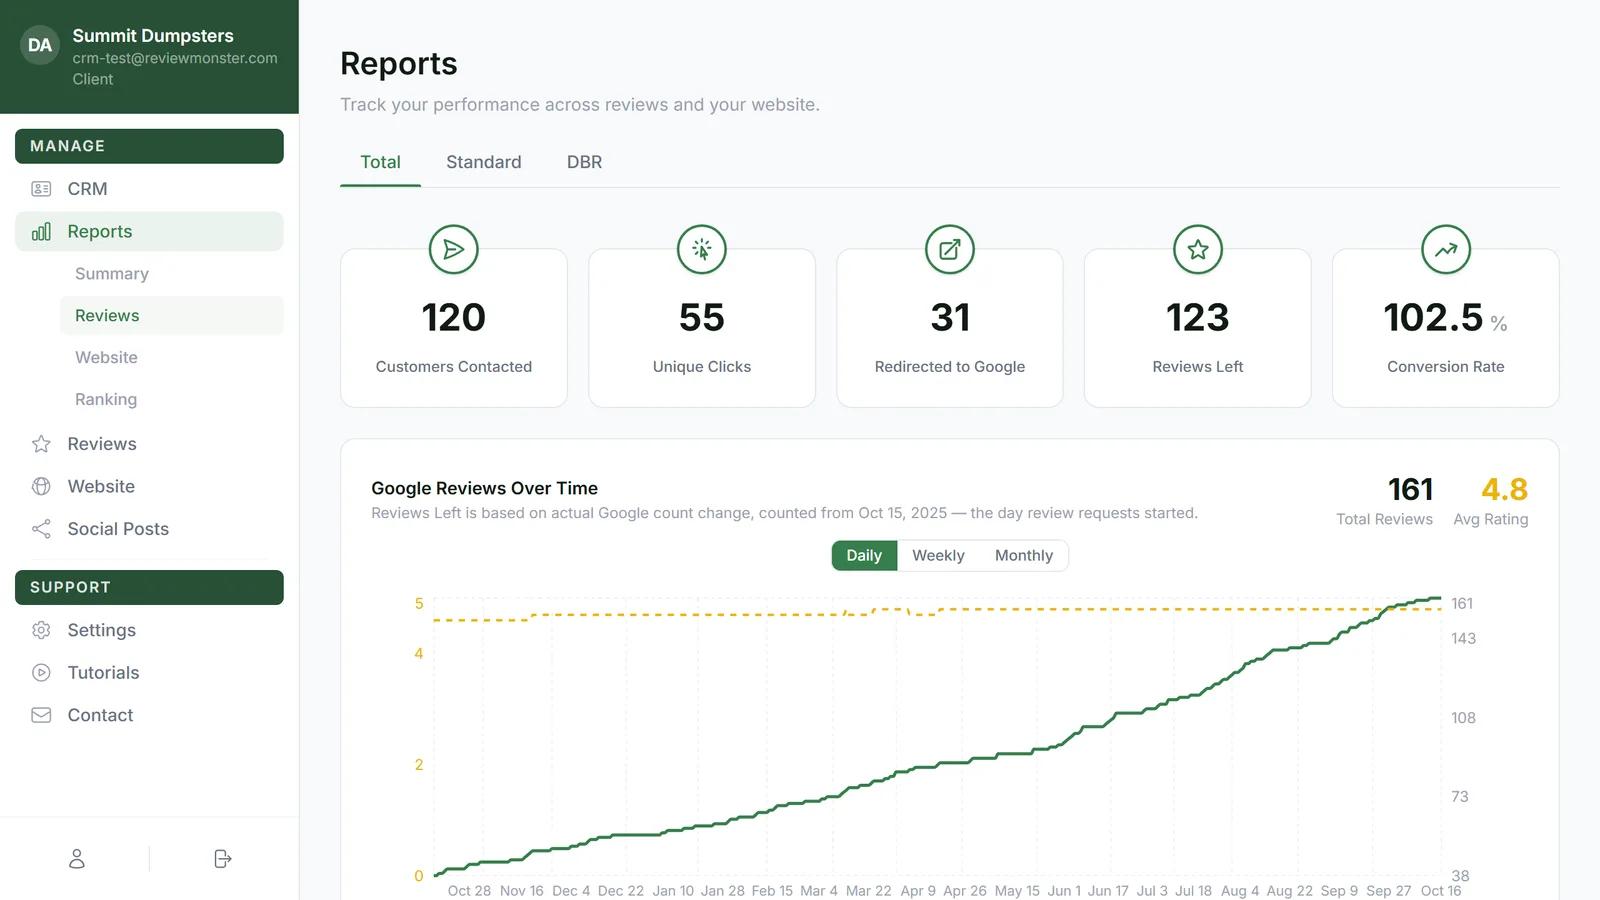
Across the top of the report are three tabs: Total, Standard and DBR. Standard covers the requests that go out after a job, DBR covers your past-customer reactivation list, and Total adds the two together. Every section below follows the tab you pick, and a few only show on certain tabs. We'll point those out as we go.
The numbers at the top
Under the tabs is a row of cards:
- Customers Contacted – how many people have been sent at least one request.
- Unique Clicks – how many people opened your review link and picked a rating face.
- Redirected to Google – how many people went on to your Google review page.
- Reviews Left and Conversion Rate – only on the Total tab. Reviews Left is how much your Google review count has grown since review requests started, and Conversion Rate is that growth as a share of the customers contacted.
The 2-Week Pipeline
The 2-Week Pipeline is a row of colored boxes showing where your contacts sit in the outreach sequence right now:
- Contacted – everyone who's been sent at least one message.
- SMS 1, Email 1, SMS 2, Email 2 – how many people's latest message was that step. Someone who's had the first text and the first email counts under Email 1.
- Clicked Link – how many people opened your review link in the past two weeks.
- Reviews Left – how much your Google review count went up over the past two weeks. This box only shows on the Total tab.
If lots of people sit at SMS 1 and few move on or click, take a look at your first message or your send times.
DBR Outreach Progress
On the DBR tab, a progress bar shows how far through your past-customer list you are. It reads as completed contacts out of the total you imported, with a percentage. A contact counts as completed once they're no longer waiting on a message. People who opted out partway don't count as completed.
The Lifetime Funnel
The Lifetime Funnel only shows on the Total tab. It's an all-time count that never resets, one bar per row:
- SMS Sent and Email Sent – every request you've sent.
- Unique SMS Clicks and Unique Email Clicks – people who clicked the link in a text or an email.
- Went Direct to Google – people who went straight to your Google review page.
- Clicked a Face – people who picked a rating face on your review page.
- Reviews Left – how much your Google review count has grown since review requests started.
The counts are based on each visitor's final action, so someone who clicks twice still counts once.
Requests Over Time
Requests Over Time is a line chart of the requests you've sent. Each line is a step in the sequence: Total (the dashed line), 1st Text, 1st Email, 2nd Text and 2nd Email. A line only appears once it has something to show.
To change how the chart is grouped:
- Above the chart, click Daily, Weekly or Monthly.
- Hover over any point to see the counts for that day, week or month.
Rating Breakdown
Rating Breakdown shows how people rated you on your review page: Excellent, Good, Ok and Bad, each with a count and a percentage. Only the last face someone picked before leaving counts, so a person who taps Ok and then switches to Excellent shows up once, under Excellent.
Clicks by Request
Clicks by Request is a ring chart showing which message got people to click your link, labeled by channel and round, like SMS 1 or EMAIL 2. Next to the chart, each slice lists its share as a percentage and its number of clicks.
Reviews Left by Day of Week
Reviews Left by Day of Week is a bar chart of new Google reviews by weekday, based on changes in your Google review count. It shows on the Total and DBR tabs, not on Standard. Use it to spot the days your customers are most likely to leave a review.
Recent Activity
At the bottom, Recent Activity lists the people who've visited your review page over the last three months: the Date, the Contact, the face they picked under Rating, and a check under Redirected if they went on to Google. On the Total tab, a Source column tags each one DBR or Triggered, so you can follow a single customer from your request to their review.