In this article, you'll learn how to use the Tips report to see every tip your clients have left and who it belongs to. It's handy at payroll time, or any time someone asks what they've made in tips this month.
You don't need to switch anything on first. Any tip recorded on a collected payment shows up here, whether the client tipped through a card payment or you entered it yourself. To learn how tips get recorded in the first place, see How to collect tips from clients.
To open the Tips report:
- In the menu, click Reports.
- Under Business reports, click the Tips tile.
The same steps work in the phone app: open the menu, tap Reports, then tap Tips. The app draws the same report from the same numbers, so your phone and your desktop always agree.
Choosing a date range
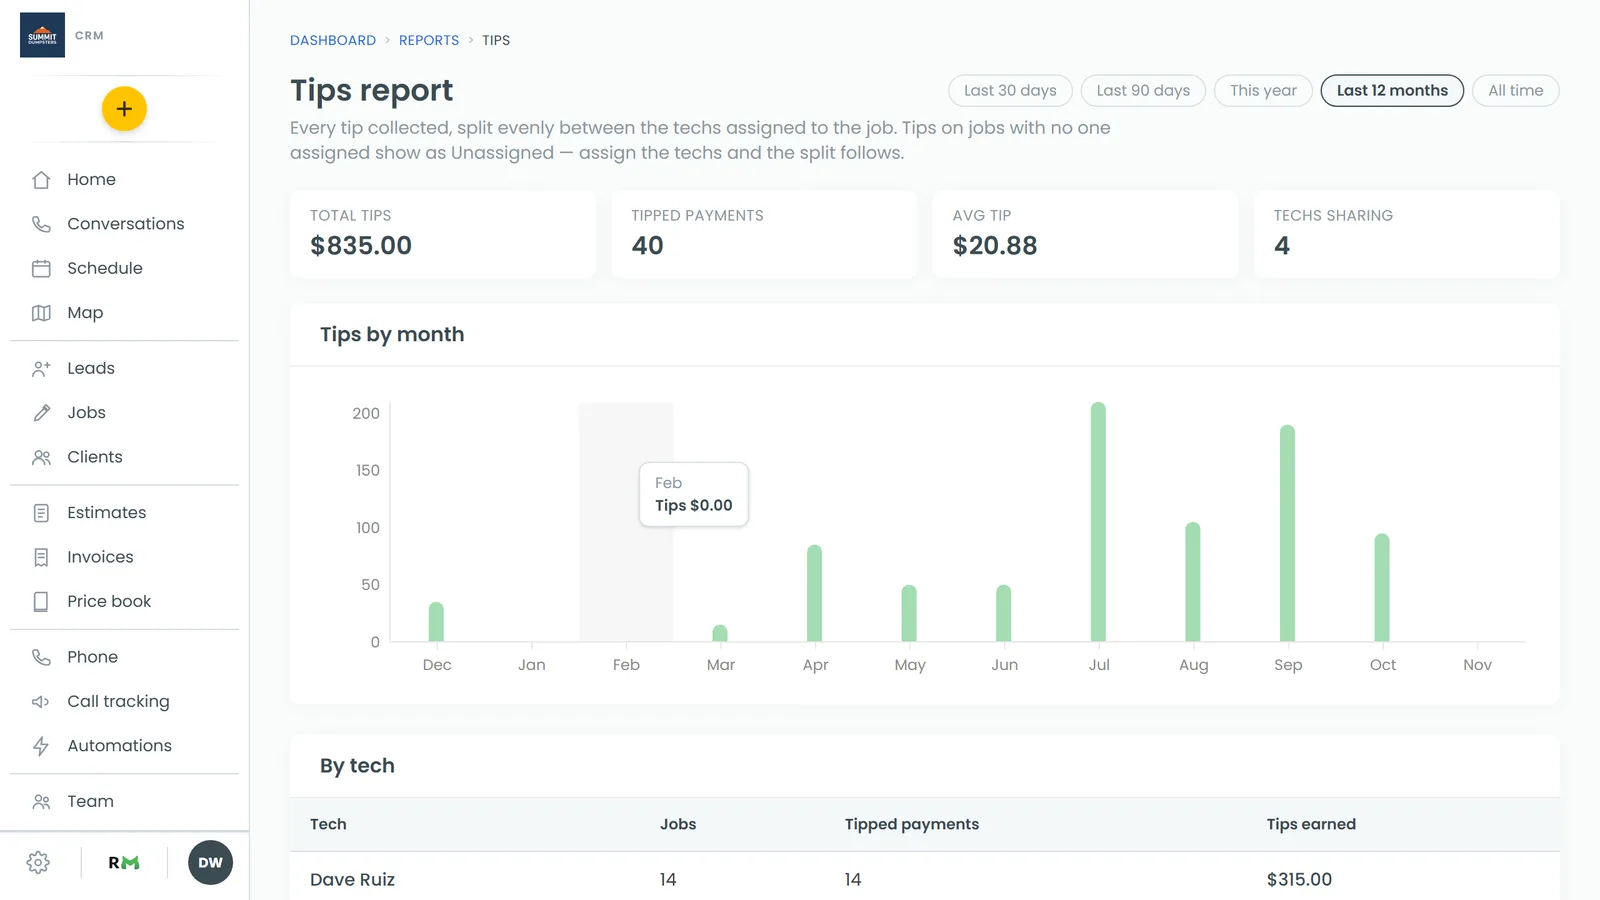
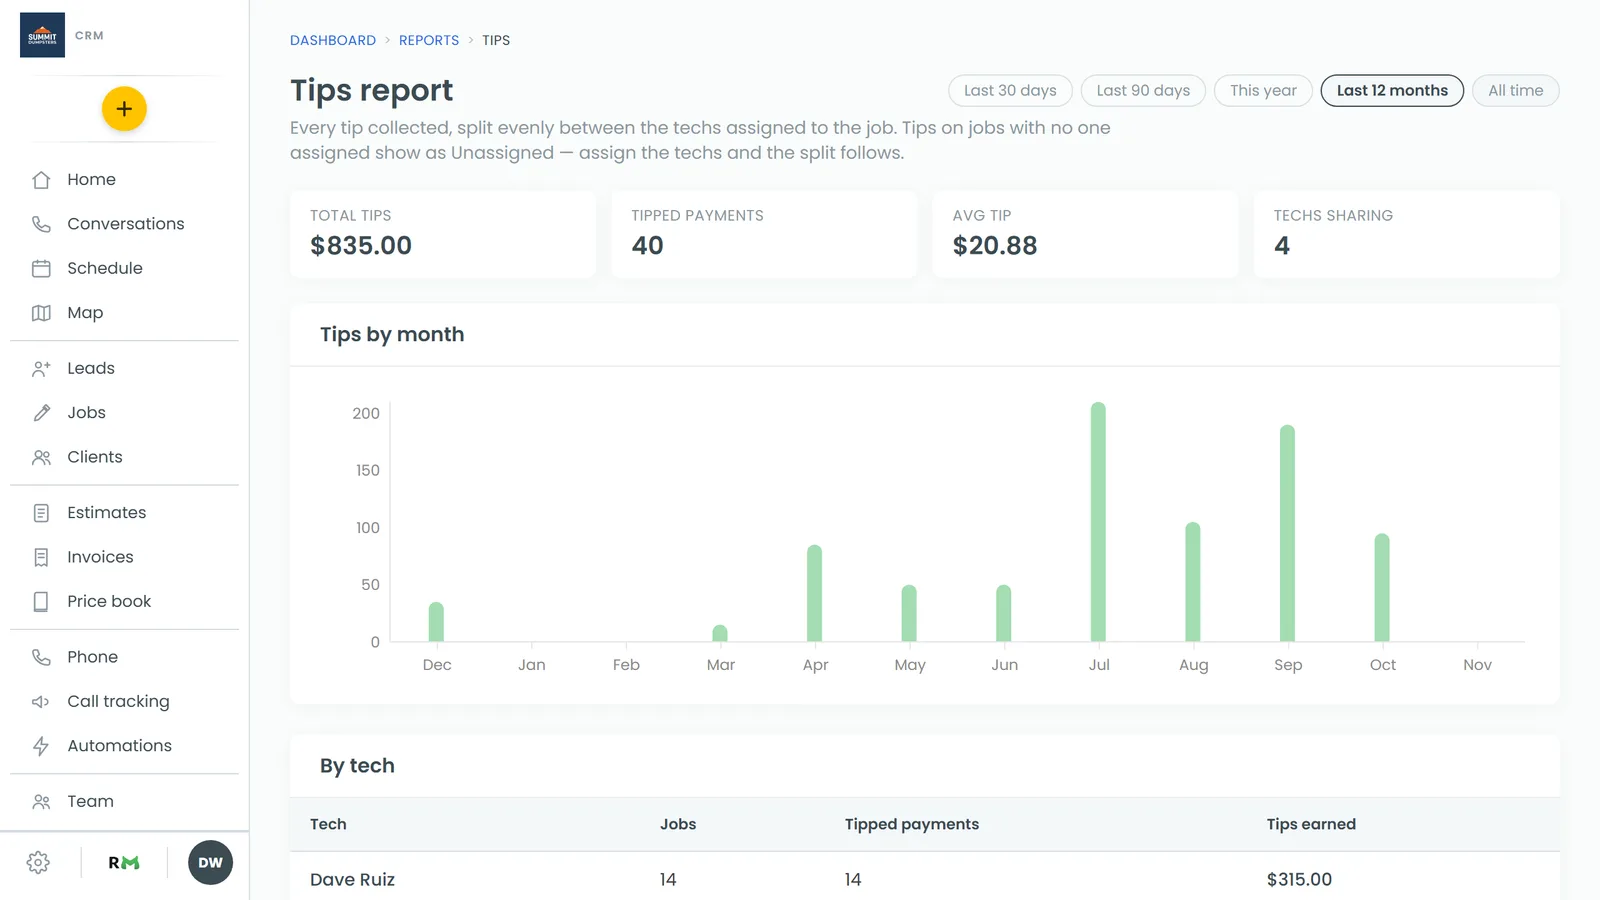
On a desktop, the pills at the top right set the window the report covers: Last 30 days, Last 90 days, This year, Last 12 months or All time. The report opens on Last 12 months. Click a pill and everything on the page (totals, chart and both tables) updates to that window. The date used is the payment's date.
On a phone, in the browser or the app, the pills become one boxed Range field under the heading. Tap it and pick the window from the sheet that slides up.
Reading the totals
Four tiles sit across the top:
- Total tips is everything tipped in the window.
- Tipped payments is how many payments included a tip.
- Avg tip is the total divided by the number of tipped payments.
- Techs sharing is how many team members got a share. Unassigned tips don't count here.
Under the tiles, Tips by month charts the total for each month in the window. A month with no tips still shows as an empty bar, so a slow month is easy to spot.
Seeing what each person earned
The By tech table lists everyone who got a share, highest first. For each person you'll see:
- Jobs: how many different jobs their tips came from.
- Tipped payments: how many tipped payments they shared in.
- Tips earned: their total share for the window.
If nothing was tipped in the window, the table says No tips in this window.
How tips are split
Each tip is split evenly between everyone assigned to that job, down to the cent. If a tip doesn't divide evenly, the leftover cents go to the first names in the list, so the shares always add up to the full tip.
The split uses whoever is assigned to the job when you open the report, not who was assigned on the day it was paid. If you fix a job's crew after the fact, that job's tip moves to the new people the next time you look. To change who's on a job, see Assigning team members to jobs.
Tips on a job with nobody assigned, or on a payment that isn't tied to a job, show under Unassigned. They still count in Total tips, so nothing goes missing. Assign the job and its tip moves to that person.
Looking at every tip
The Every tip table lists each tipped payment, newest first, with the Payment number, Date, Client, Job, Tip amount and Split between, which shows each person's name and their share. Click the job number to open that job.
On a phone, each row stacks into a block with the payment number across the top and the other figures labelled underneath. In the app, long tables show 50 rows at a time, with a Show 50 more link at the bottom.