In this article, you'll learn where your reports are, what each one covers, and how to choose who on your team can see them. Reports show your money: sales, payments, invoices, expenses. So it's worth checking who has access before you add someone new.
To open your reports:
- In the menu on the left, click Reports.
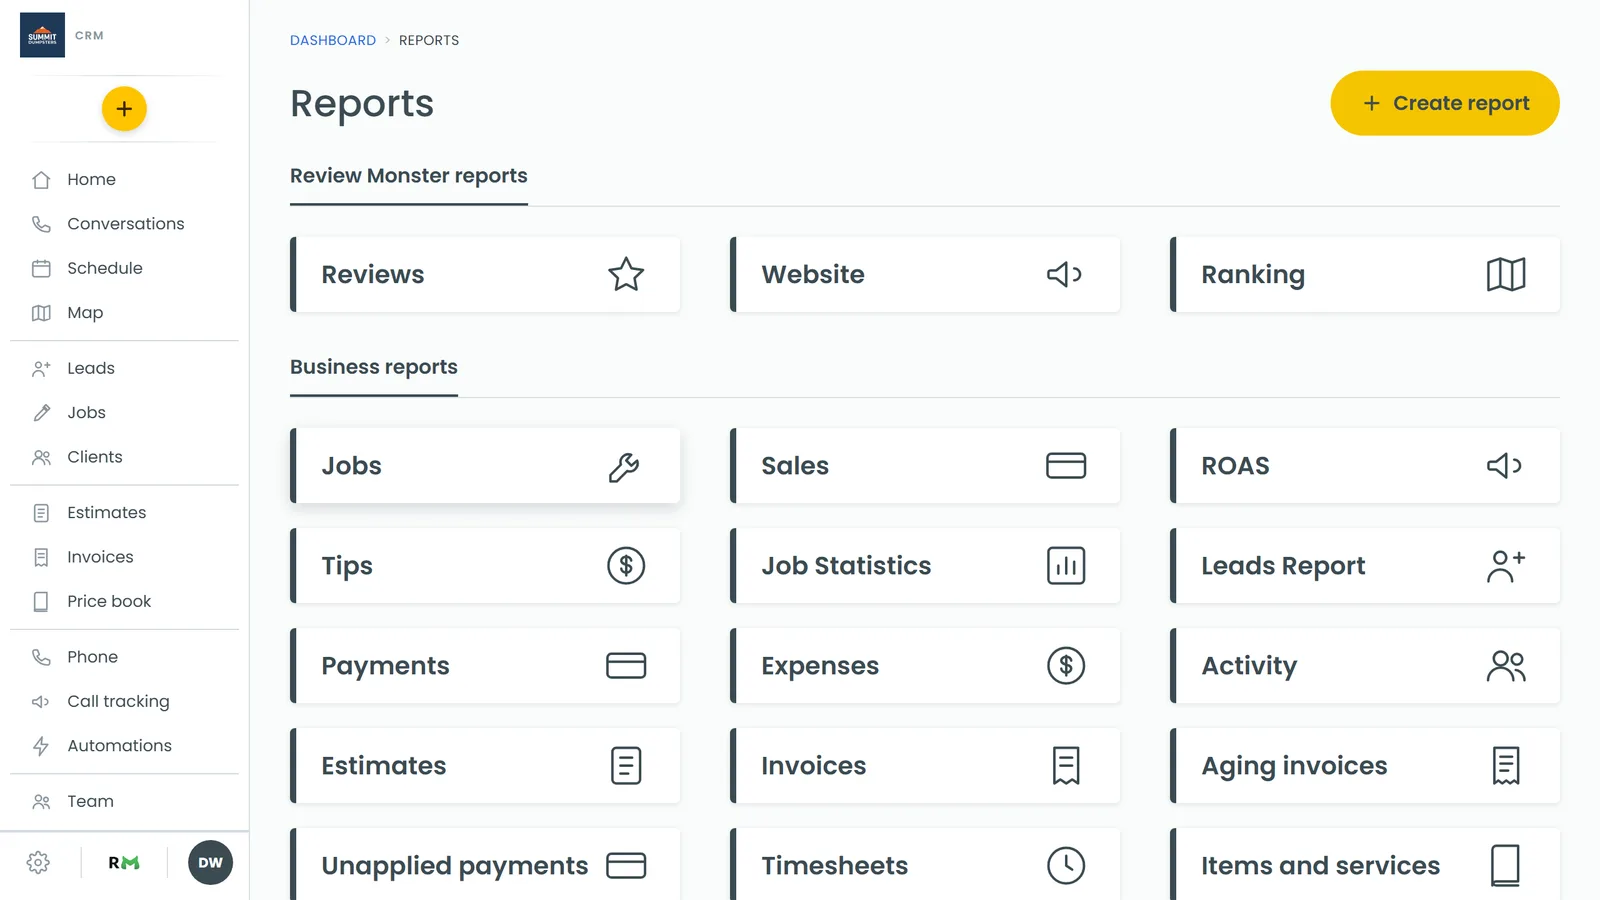
- Under Business reports, click a tile to open that report.
Who can see Reports
Reports isn't something you switch on in Features. It's in the main menu, but it only shows for people whose role has the Financial Data permission ("Can view prices, totals and costs on jobs and invoices."). The same permission decides who sees Estimates and Invoices in the menu, on the web and in the phone app.
It's one setting for all of Reports. If a role has Financial Data, everyone with that role sees the Reports menu item and every report on it, the Review Monster reports included. If it doesn't, the menu item doesn't show at all. You can't give someone one report and keep them out of another.
Here's where each role starts:
- Admin always has every permission, including Financial Data. You can't edit it.
- Tech and Subcontractor start with Financial Data turned on.
- A role you create yourself starts with every permission off, so it won't see Reports until you turn Financial Data on.
Turning Reports on or off for a role
You change permissions in the web CRM on a desktop. The phone app has no roles editor, and at phone width the web page only tells you to use a desktop.
- Click the Settings gear at the bottom of the menu.
- Under Users & roles, click Roles & permissions.
- Click the role you want to change, for example Tech. (Admin can't be opened, since it always has everything.)
- In the Search box, type Financial, or scroll to Financial Data.
- Switch Financial Data on to show Reports, or off to hide it.
- Click Save.
The change applies to everyone with that role. To give one person different access, put them on a different role. How to add team members covers roles and who's on them.
The reports you can open
These tiles under Business reports show your data today:
- Jobs: your most recent 100 jobs by scheduled date, with client, type, status and total, plus a total row at the top.
- Sales: revenue, jobs, average job, collected and outstanding, with revenue by month, by job type and by source.
- ROAS: spend, leads, jobs booked, jobs paid and revenue for each source, so you can see what your marketing returns.
- Tips: tips collected, by month and by tech.
- Job Statistics: jobs created, done, canceled and unscheduled, by status, type and city.
- Leads Report: your latest 300 leads, website form leads included, with how many converted by source.
- Payments: the money that came in, by method and by who collected it.
- Expenses: the money that went out, by category. It reads your Bookkeeping ledger, so there's nothing in it until you've connected a bank there.
- Estimates: estimates created, their approval rate and how many became jobs.
- Invoices: invoiced, collected and outstanding, with every invoice listed.
- Aging invoices: unpaid invoices and how many days overdue each one is.
- Unapplied payments: money you've received that isn't on a job yet. That's deposits paid on estimates that haven't become a job, payments with no invoice, and anything paid on a canceled job. Oldest first, and anything over 30 days shows in red.
- Items and services: how many of each item you've used, and what they added up to.
Review Monster reports
If your plan includes them, a Review Monster reports section sits above the business reports with Reviews, Website and Ranking. They're the same reports as in your Review Monster dashboard, shown for the business you have open in the CRM. Website shows a short note until your website is live. Changing the tracked searches on Ranking is for admins only.
Changing the date range
Most reports have a row of date buttons near the top:
- Last 30 days
- Last 90 days
- This year
- Last 12 months
- All time
A report opens on Last 12 months. Click another button and the report reloads for that window. On a phone-sized screen the buttons become one Range field that opens a picker.
Jobs, Leads Report, Aging invoices, Unapplied payments and Items and services don't have these buttons. Jobs shows your latest 100 jobs, Leads Report your latest 300 leads, Aging invoices and Unapplied payments what's outstanding right now, and Items and services everything on record.
Reports on the phone app
The phone app has a Reports menu item too, with the same Financial Data rule and the same tiles. Every report opens in full there, with the same numbers as the web. The date buttons become a Range field that opens a picker, and long tables load 50 rows at a time with a Show more link at the bottom.
Good to know
- There's a Create report button at the top of the page, but you can't build your own reports yet. Clicking it only shows a message.
- There's no export to PDF or CSV from Reports. If someone without access needs a figure, you'll have to share it yourself.