In this article, you'll learn how to read the Sources section at the bottom of your Website report. It shows where each new customer first came from and how they reached out: a quote request, a form, a booking, a chat, a text or a call. It's the quickest way to see which of your sites and phone numbers are actually bringing in work.
To open Sources:
- In the dashboard menu, click Reports.
- Under it, click Website.
- If you have microsites, pick your main site from the row of site cards at the top. It's the one marked Main site.
- Scroll to the bottom of the page. Sources is the last section.
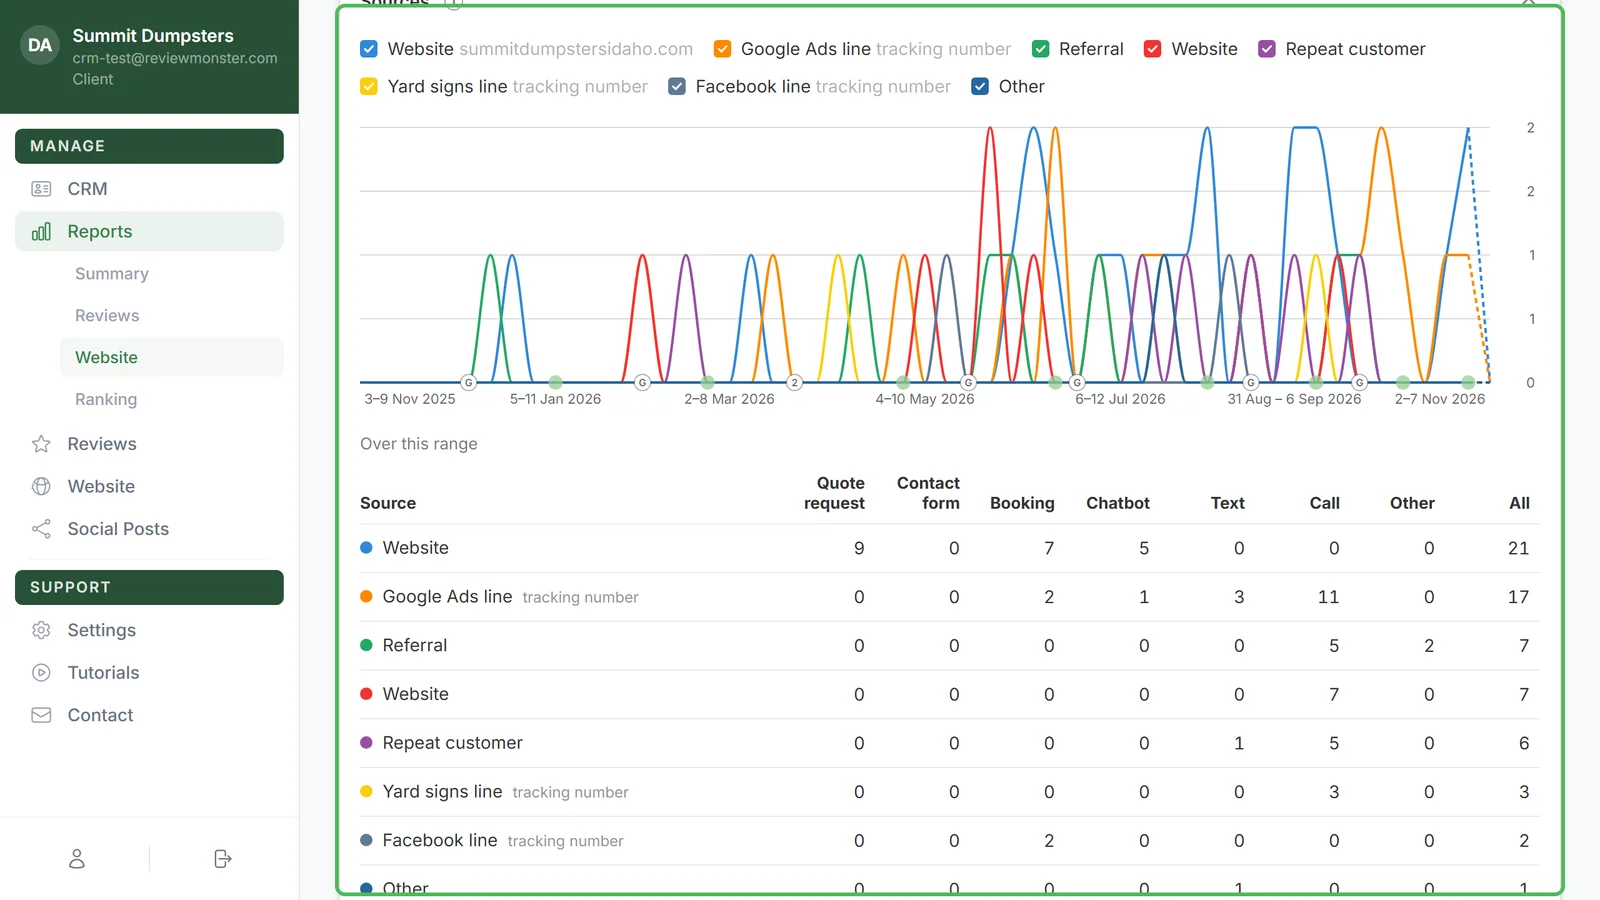
What each line is
Every source gets its own line on the chart, in its own color. You'll see a line for:
- Website, your main site, with its domain under the name.
- Each microsite, marked microsite next to its name.
- Each tracking number, marked tracking number.
- Each of your published phone lines that people call or text, like Main line, marked phone line. Only callers and texters count on a line.
- Everyone else, grouped by the Source on their record. If you set a client's Source to Referral, they show up on a Referral line. If their record has no Source, they're counted under Other.
Each person is counted once, on the source where they first reached you. Customers you imported from a spreadsheet aren't counted anywhere.
The line shows that source's total new contacts for each week or month. Click a name above the chart to hide or show its line. A checked box is filled with the line's color. An unchecked one is white.
How people reached out
Every new contact is sorted into one of seven columns:
- Quote request: they filled in a quote form on your site.
- Contact form: they sent your contact form or another site form.
- Booking: they booked online.
- Chatbot: they used the chat on your website.
- Text: they texted you first.
- Call: they called you first.
- Other: your office entered them, or how they first got in touch isn't known.
The hover breakdown
Hover anywhere over the chart and a card opens for that week or month. It has one row per source you've got checked, with a column for each way people reached out (Quote, Form, Booking, Chat, Text, Call, Other) and the total under All. A period with nothing in it says Nothing in this period.
The hover also moves along every other chart on the page at the same time, so you can line up a jump in calls with a jump in traffic.
The Over this range table
Under the chart, Over this range adds everything up for the whole range you've picked: one row per source, a column for each way people reached out, and All at the end. The busiest source is at the top. On a narrow screen, the table scrolls sideways.
The dashed tail at the end
The last week or month usually isn't over yet, so its count would look low next to the full ones. Instead, the chart shows an estimate for the whole period: what's come in so far, plus what a normal rest of the week or month adds, going by your last few. That part of the line is dashed, and the hover card's title says projected. As the period fills in, the estimate settles onto the real number.
Changing the range
Sources follows the same controls as the charts above it. Stay on the Metrics tab and use the date menu (from Last 3 months to All time; Last year is the default) and the Weekly or Monthly menu. Whatever you pick there changes the chart and the Over this range table too.
On the phone app
The same report is in the phone app. Tap Reports, then under Review Monster reports tap Website. The Sources section is at the bottom of the Website report. Touch the chart and slide your finger to move along it. The card lists each source with its breakdown in brackets and the total on the right. Tap the same point again to put the card away. The range and grouping menus open as a sheet, and the Over this range table scrolls sideways.