In this article, you'll learn how to read the Performance chart on your Website report. It puts your Google traffic, your backlinks and your pages on one timeline, so you can see whether your site is growing and line that up with what changed.
To open the Performance chart:
- In the menu, click Reports.
- Under Reports, click Website.
- If you have microsites, click the site you want in the row of site buttons at the top. Your main site comes first and carries a Main site tag.
- Scroll past Visitors to the Performance card.
The same report is inside the CRM. Click Reports in the CRM menu, then Website under Review Monster reports. On the phone app, open Reports and tap Website under Review Monster reports. Every version has the same sections.
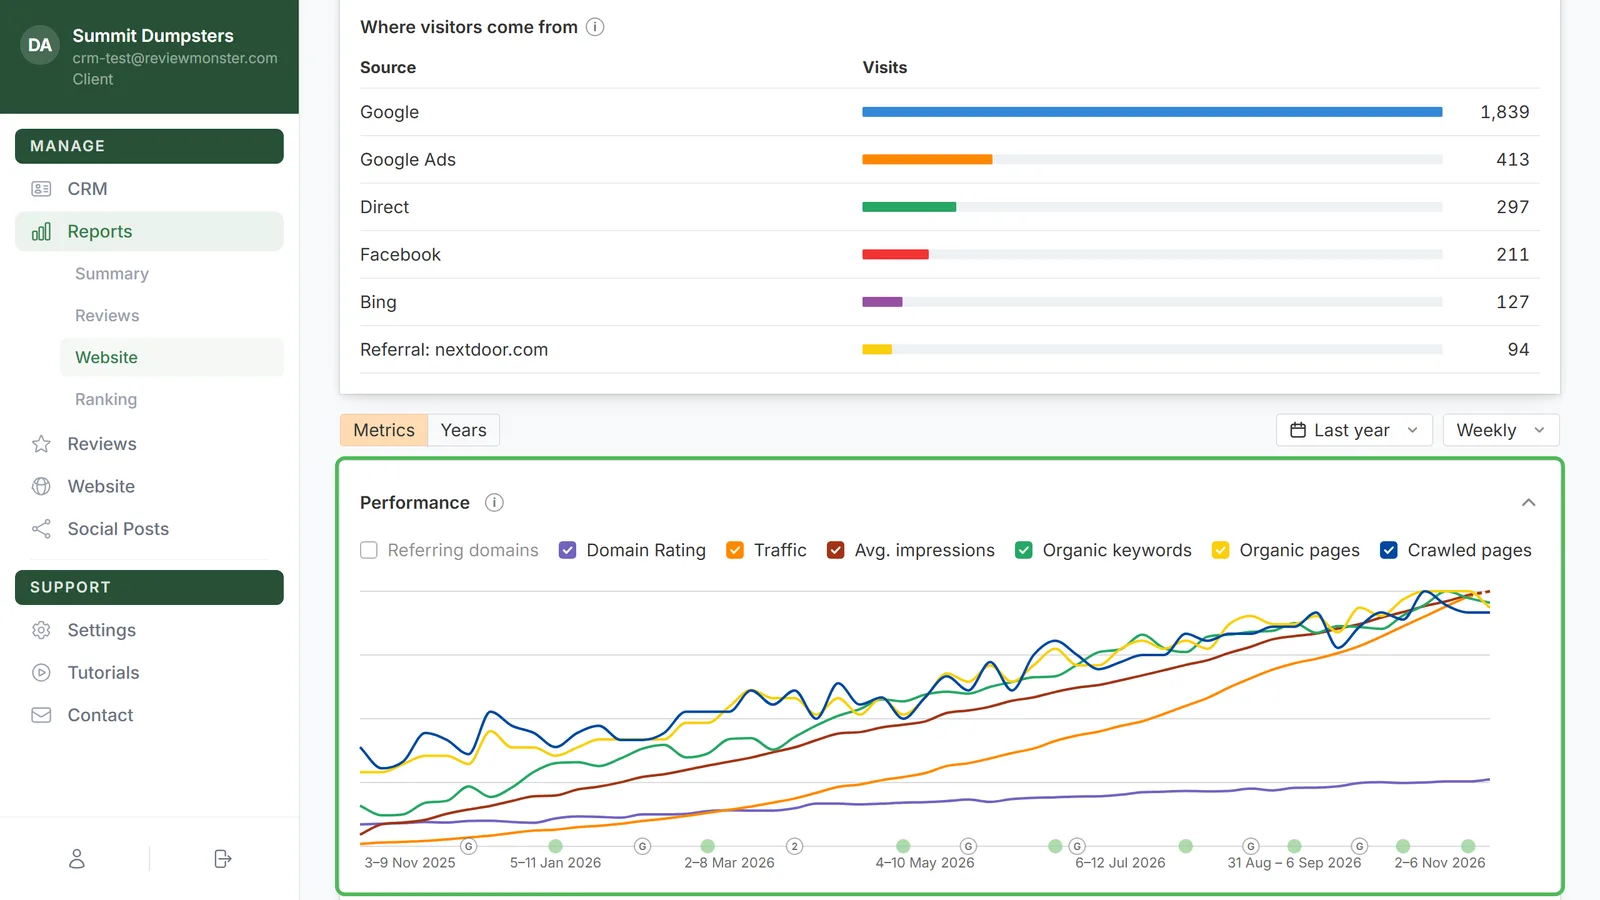
What the seven lines mean
Each line has a coloured checkbox above the chart:
- Referring domains: how many other websites link to yours. It starts unchecked.
- Domain Rating: an estimate of how strong your backlinks are, on a scale of 0 to 100.
- Traffic: clicks from Google search, straight from Google Search Console. In weekly view it's averaged over four weeks, so it's smoother than the raw count.
- Avg. impressions: how often your site showed up in Google results, averaged the same way.
- Organic keywords: how many searches your site shows up for.
- Organic pages: pages on your site that show up in Google.
- Crawled pages: every page on your site, counted from its sitemap.
Traffic and impressions are Google's own numbers. Everything else is an estimate, read once a week; the footnote under the charts shows the date of the last reading. Each line sits on its own scale so they all fit on one chart, so read the actual numbers from the hover card rather than the grid. Hover the i next to the card title for a one-line reminder of what the card shows. On the phone app, tap the i instead.
Turning lines on and off
- Click a checkbox in the strip above the chart to hide that line.
- Click it again to bring it back.
A filled box means the line is showing. A white box means it's hidden.
Choosing the range and the grouping
The two menus above the card set the timeline for every chart on the page.
- Open the calendar menu and pick a range: Last 3 months, Last 6 months, Last year, Last 2 years, Last 3 years, Last 5 years or All time. Last year is the default.
- Open the menu next to it and pick Weekly or Monthly. In Monthly, Traffic and Avg. impressions show each month's own total instead of a four-week average.
On the phone app these menus open as sheets titled Range and Group by.
Reading a point with the hover card
Move your mouse across the chart. A thin line and a dot on each visible line follow you, and a card shows the dates for that week or month with every line's value.
The hover is shared across the whole page. The same week lights up on Organic positions, SERP features and Sources, so you can compare them at a glance.
On the phone app, touch the chart and slide your finger. The card stays when you lift your finger, so you can tap what's on it. Tap the same spot again to put it away.
The G markers and the green dots
Markers sit along the bottom edge of the chart.
- G marks a Google ranking update. Hover it to see the date, the update's name, a plain explanation of what that kind of update does, and a Learn more link to Google's note. If more than one update landed in the same period, the marker shows a number and the card lists them all.
- Green dots mark changes made to your site. The bigger and darker the dot, the more of the site changed. Hover a dot to see the date and the size of the change (Minor changes, Moderate changes, Major changes or Overhaul changes), then click View changes to open the list of what changed in that period.
On the phone app, tap the point above a marker. The updates and changes for that period are listed at the bottom of the card. Tap an update's name to read what it did, or tap View changes to open the list.
The dashed tail at the end
Traffic and impressions are added up day by day, so a week or month that's still going would read low. The chart projects those two lines to the full period instead: what you have in so far, plus what a normal rest of the period adds, based on your last few weeks or months. The projected part is drawn as a dashed line, and the hover card says projected.
Google reports a few days late, so the week before the current one can be projected too. The estimate settles onto the real total as the period fills in. Domain Rating, keywords and pages are never projected.
Comparing years with Years mode
- Above the cards, click Years.
- Next to the Performance title, open the menu and pick what to compare: Organic traffic, Impressions, Referring domains, Domain Rating, Organic pages, Organic keywords or Crawled pages. On the phone app this menu sits at the right of the card's title and opens a sheet titled Metric.
- Use the Daily or Monthly menu at the top right to choose how fine the line is.
- Tick or untick the years in the checkbox strip above the card to choose which ones are drawn, each in its own colour. The two most recent years start ticked.
Each year is laid over the same January to December axis, so you can see whether this spring beat last spring. In Daily, Organic traffic and Impressions are smoothed over seven days. In Monthly, the month you're in is scaled up to a full month and drawn dashed for those two.
To go back to the seven lines, click Metrics.