In this article, you'll learn how to read the Reviews report in your dashboard. It shows how many customers your review requests reached, how many clicked through, and how your Google review count has moved since requests started. That's how you tell whether the requests are paying off.
To open the Reviews report:
- In the dashboard menu, click Reports.
- Under it, click Reviews.
On plans that include review requests, clicking Reports opens the Reviews report first. The same report also opens from your CRM's Reports page, under Review Monster reports, on the web and in the phone app.
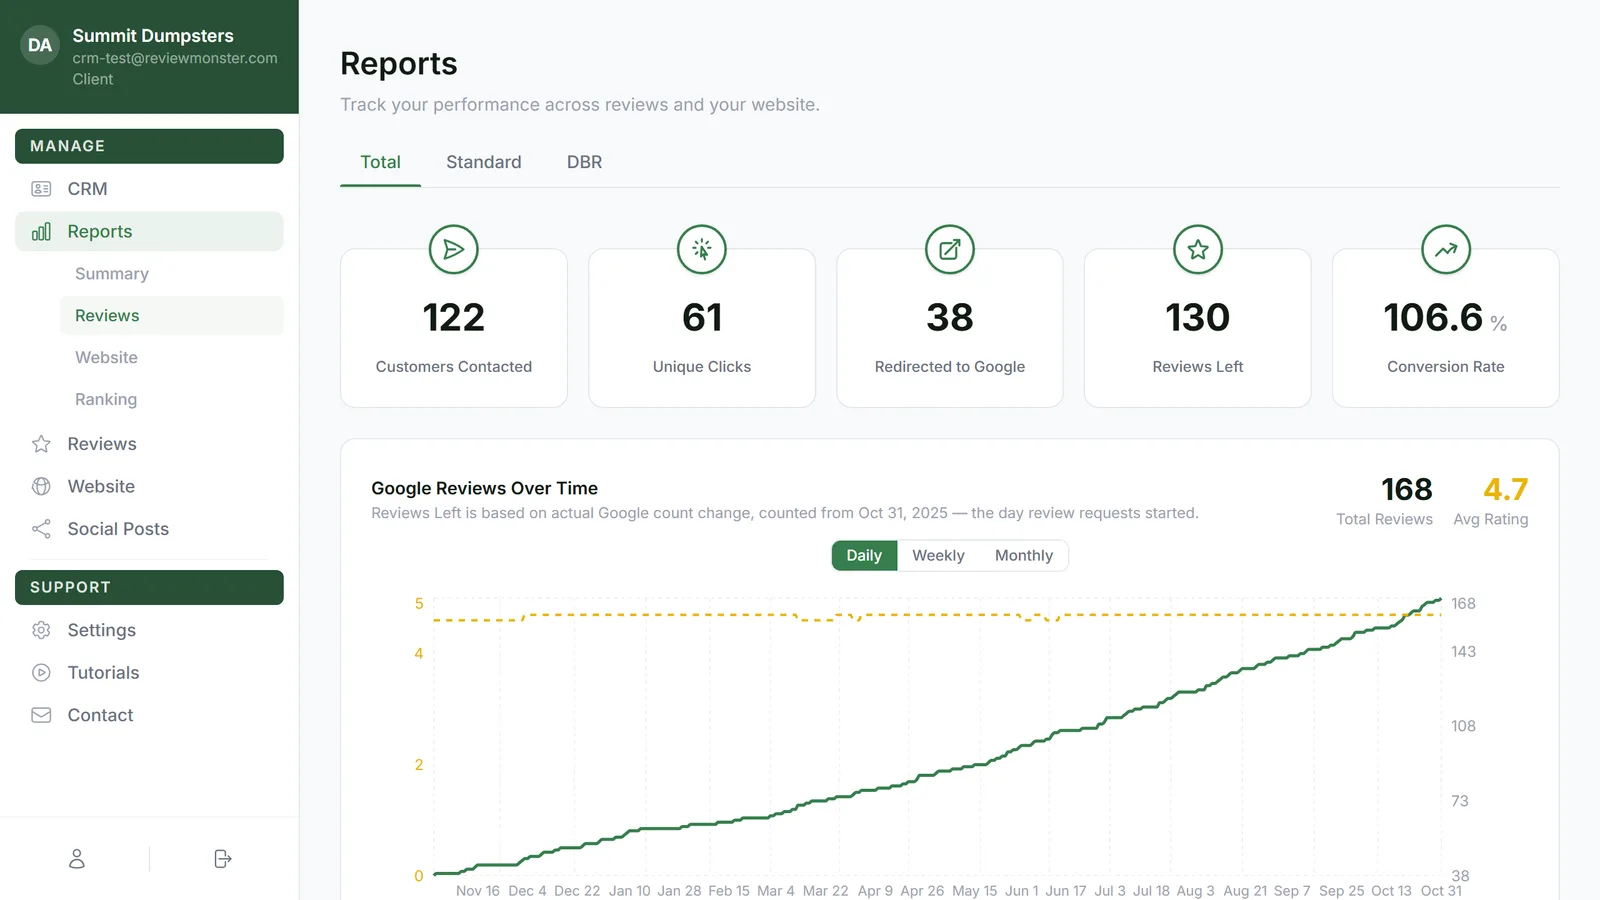
Switch between Total, Standard and DBR
There are three tabs across the top of the report:
- Total shows everything together.
- Standard shows only the requests that go out automatically after a job.
- DBR shows only your Database Reactivation outreach, the requests sent to past customers.
Click a tab to switch. Here's what changes when you do:
- Cards: Total shows all five. Standard and DBR show three: Customers Contacted, Unique Clicks and Redirected to Google.
- Google Reviews Over Time and Reviews Left by Day of Week show on Total and DBR, not on Standard.
- The Lifetime Funnel only shows on Total.
- The DBR Outreach Progress bar only shows on DBR, once you've added past customers.
- The Recent Activity table lists only that tab's requests, and its Source column only appears on Total.
The cards
- Customers Contacted is how many people have been sent at least one review request.
- Unique Clicks is how many different people opened their link and tapped one of the rating faces.
- Redirected to Google is how many were sent on to your Google review page.
- Reviews Left is how much your Google review count has grown since review requests started.
- Conversion Rate is Reviews Left divided by Customers Contacted, as a percentage.
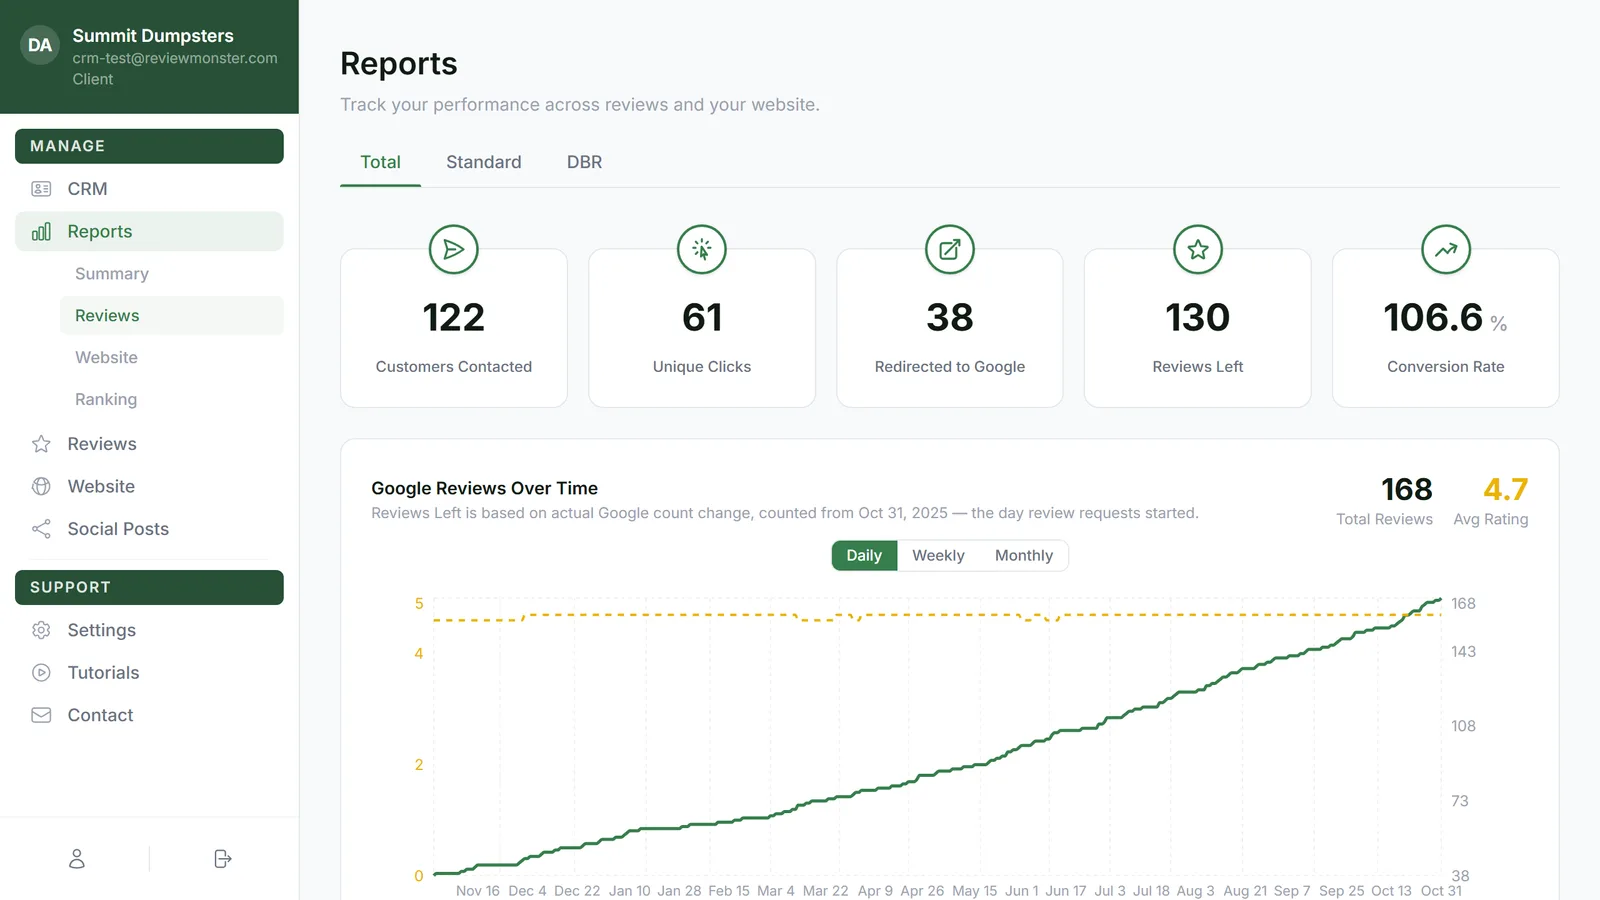
Google Reviews Over Time
This chart follows your Google listing over time. The green line is Total Reviews (its scale is on the right) and the dashed gold line is Avg Rating (0 to 5, on the left). The two big numbers next to the title are your current total and your current average.
The line under the title tells you the date the report counts from: the day your review requests started. The reviews you already had that day are your starting point, not something the report takes credit for.
Use Daily, Weekly and Monthly above the chart to change how it's grouped. Weekly and monthly show one point per week or month.
The other charts
Further down the page you'll find:
- 2-Week Pipeline: where contacts sit in the text and email sequence right now. The boxes read Contacted, SMS 1, Email 1, SMS 2, Email 2 and Clicked Link, and on Total there's a Reviews Left box too.
- DBR Outreach Progress (DBR tab only): how many of your past-customer contacts have finished the sequence, as a count and a percentage.
- Lifetime Funnel (Total tab only): all-time totals for SMS Sent, Email Sent, Unique SMS Clicks, Unique Email Clicks, Went Direct to Google, Clicked a Face and Reviews Left. It never resets.
- Requests Over Time: how many texts and emails went out, with a line each for 1st Text, 1st Email, 2nd Text and 2nd Email plus a dashed Total. Only the lines with data show. It has its own Daily, Weekly and Monthly buttons.
- Rating Breakdown: how many people picked Excellent, Good, Ok or Bad, with the share of each. Only the last face someone picked counts.
- Clicks by Request: which message got the click, such as SMS 1 or EMAIL 2, as a share of all clicks.
- Reviews Left by Day of Week: which days your new Google reviews tend to come in.
Recent Activity
At the bottom is a table of people who opened a review link in the last 90 days, newest first. Each row shows:
- Date: when they opened it.
- Contact: the customer's name, or a dash if no name could be matched.
- Source: DBR or Triggered, so you know which kind of request they came from. This column only shows on the Total tab.
- Rating: the face they picked. Hover over it to see the word (Excellent, Good, Ok or Bad).
- Redirected: a green tick if they were sent on to Google.