In this article, you'll learn what's on the Website report and how to move around it. It's where you see how many people visit your site, how you're doing on Google, and how new customers found you.
To open the Website report:
- In the dashboard menu, click Reports.
- Under Reports, click Website.
Before your numbers show up
The report needs a live website. Until yours is live, the page says your website isn't set up yet, and that its ranking and traffic will show up there once it's live.
Once the site is live, we connect it to Google for you. You don't connect anything yourself. While that's happening you'll see a Ranking and traffic card saying your site is being connected to Google and the numbers will appear within a few days.
Picking a site
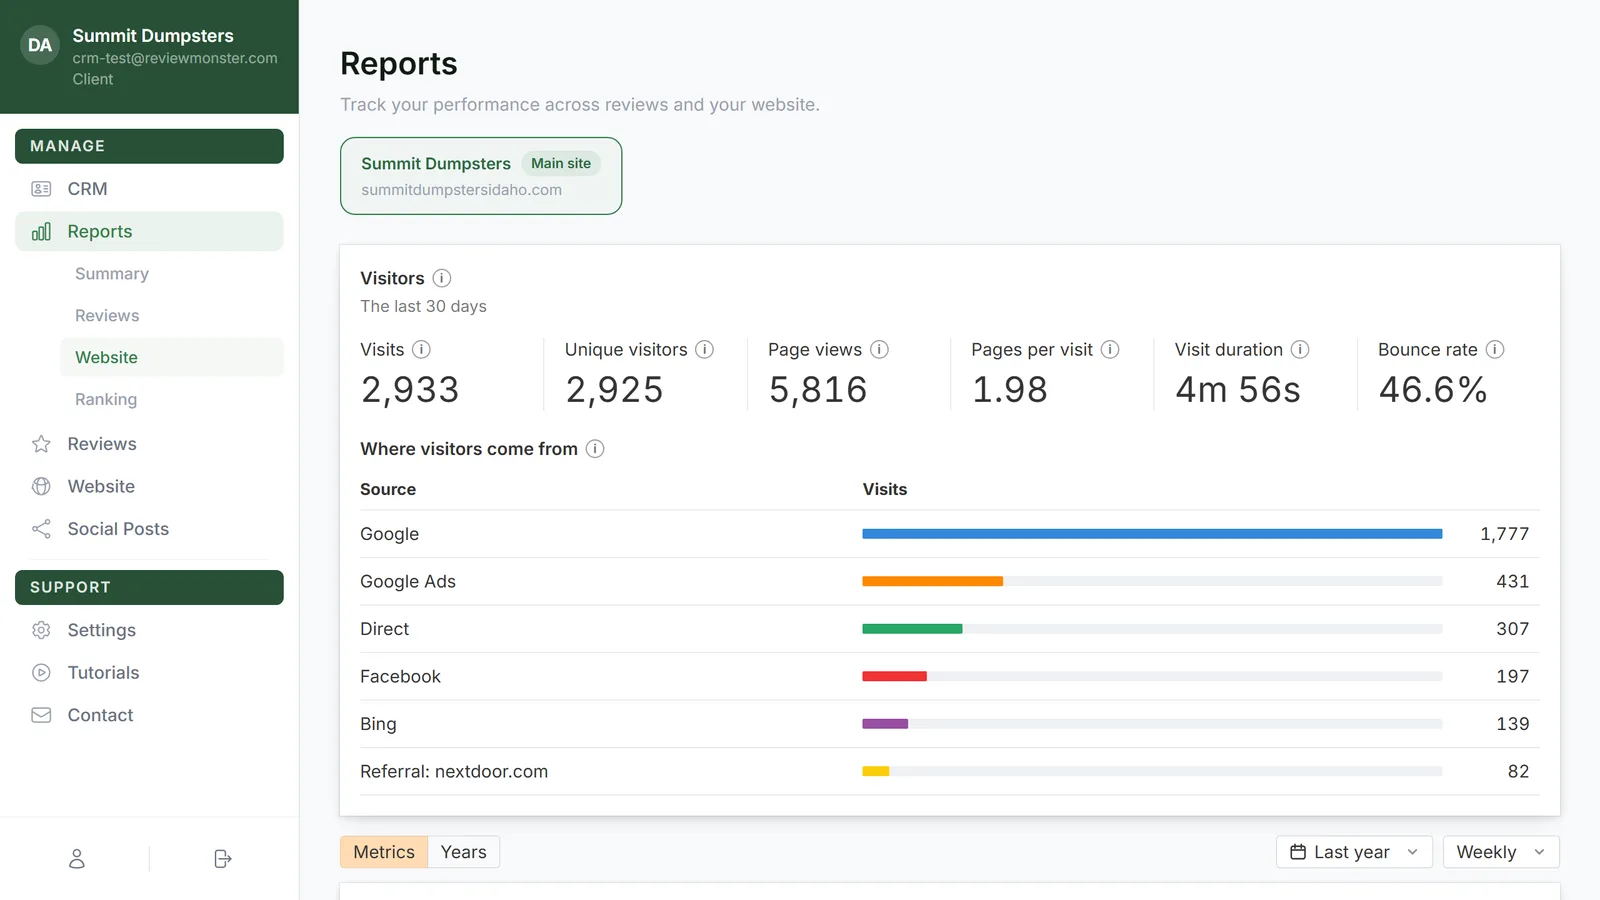
Across the top there's a tab for each site we run for you. Each tab shows the site's name with its web address underneath.
- Your main website comes first and carries a Main site badge.
- Any microsites follow, the busiest first.
- A tab marked Verifying is a site Google hasn't confirmed yet. Click it and you'll see Waiting for Google to verify this site. Verification usually goes through on its own, and the numbers appear as soon as it does.
Click a tab to see that site's report.
The Visitors card
The first card counts people who visited the site over a recent stretch of days (the card says how many). These numbers come from the site itself.
- Visits: sessions on the site. Someone coming back tomorrow is a second visit.
- Unique visitors: different people, counted once.
- Page views: pages opened across every visit.
- Pages per visit: page views divided by visits.
- Visit duration: average time from the first page to the last.
- Bounce rate: visits that left after one page.
Under those, Where visitors come from lists each source (Google, Facebook, an ad, typed in, another site) with a bar and a visit count.
Setting the time frame
Below the Visitors card is one control bar that sets the timeline for every chart under it.
- Choose Metrics to see your numbers over time, or Years to lay one year on top of another.
- In Metrics, open the date menu and pick a range: Last 3 months, Last 6 months, Last year, Last 2 years, Last 3 years, Last 5 years or All time. Last year is the default.
- Pick Weekly or Monthly to choose how the points are grouped.
In Years, tick the years you want to compare, choose Daily or Monthly, and pick which number to chart from the menu beside the Performance heading.
What's below
The sections run in this order:
- Performance
- Organic positions
- Top organic competitors
- SERP features
- Top organic keywords
- Top organic pages
- Sources, which only shows once new customers have reached you through your website, a microsite or a tracking number
Hovering over one chart moves the marker on all of them at once, so you can compare the same week everywhere. The arrow at the top right of a section folds it away.
Which numbers are exact
The note at the bottom of the page says where each number comes from:
- Traffic and impressions are Google Search Console's own numbers.
- Positions, pages, keywords, competitors, Domain Rating and referring domains are estimates, read once a week. The note shows the date of the last reading.
- When a week or month isn't fully in yet, traffic, impressions and new customers are projected to the full period and drawn as a dashed line. They settle onto the real total as the period fills.
Related articles
- Reading the Website report
- Reports in your dashboard: an overview
- Understanding your microsites
- Website overview
- Reading your weekly summary report