In this article, you'll learn how to read the Job Statistics report. It shows your workload at a glance: how many jobs came in over a stretch of time, how many got finished or canceled, what kind of work they were and which towns they were in.
It's about the number of jobs, not the money you collected. For revenue and where your customers come from, the Sales and ROAS reports cover that (more on those at the end).
To open the report:
- In the menu, click Reports.
- Click the Job Statistics tile.
Picking a date range
The report counts every job created in the window you pick, dated by the day the job was made, not the day it's scheduled for. The pills at the top right of the page set the window:
- Last 30 days
- Last 90 days
- This year
- Last 12 months (what the report opens on)
- All time
- Click a pill. The page reloads with every tile, the chart and the tables counted for that window.
The tiles across the top
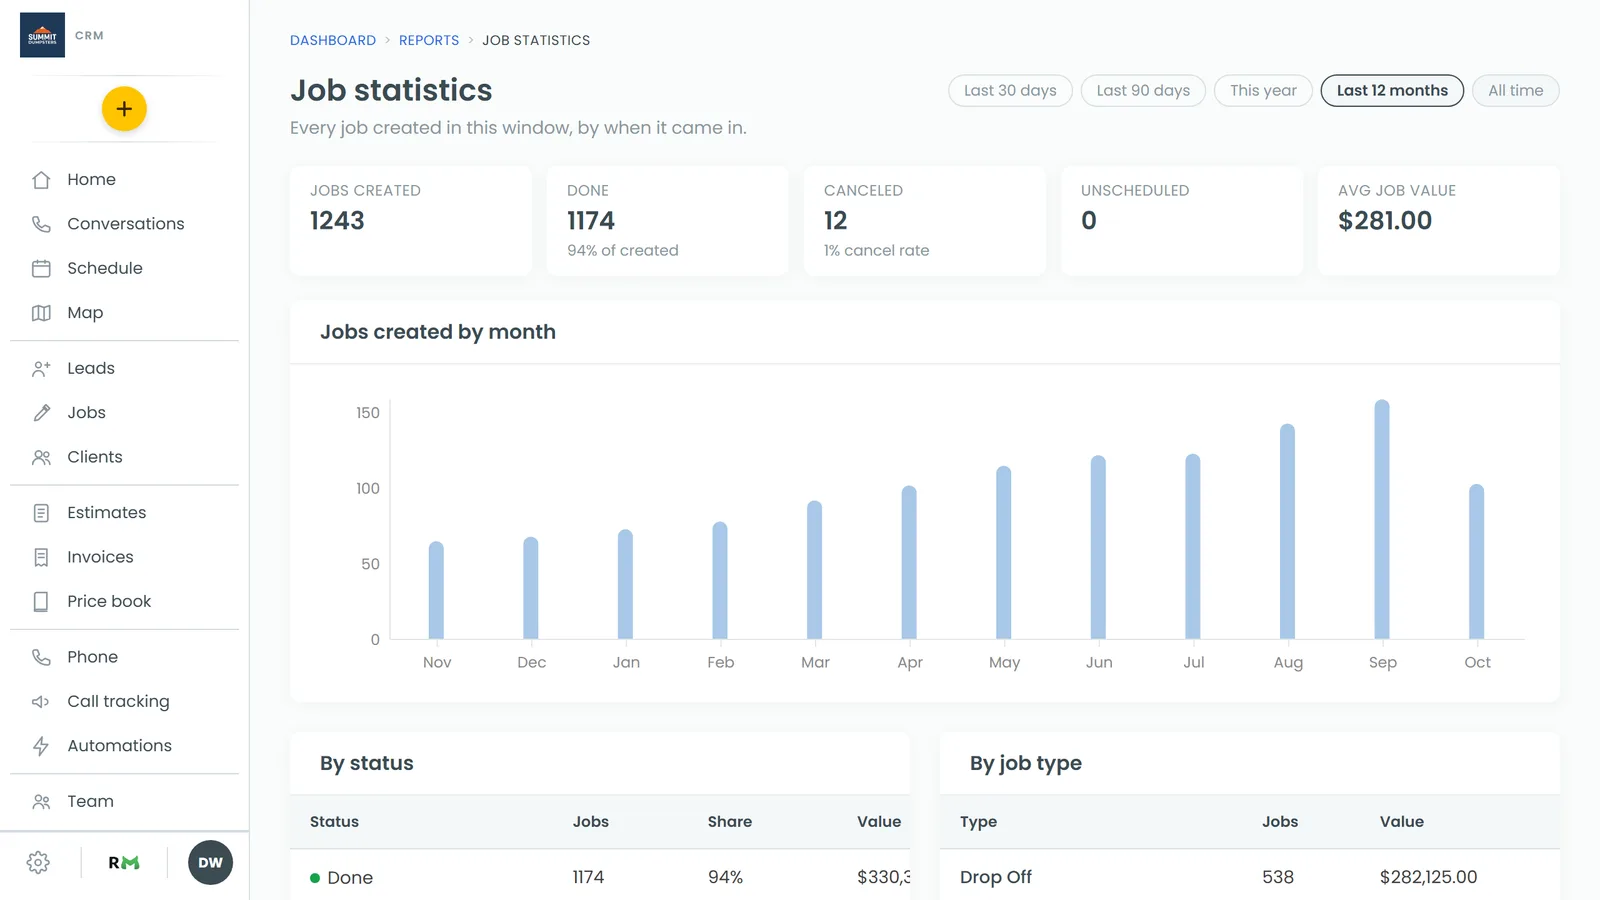
Five tiles sum up the window:
- Jobs created: every job made in the window.
- Done: how many of those are marked Done, with the share of all jobs created under it ("of created").
- Canceled: how many were canceled, with your cancel rate under it.
- Unscheduled: jobs that still don't have a date and time on the calendar.
- Avg job value: the average job total, leaving canceled jobs out so they don't drag the number down.
Jobs created by month
Under the tiles, the Jobs created by month chart has one bar per month in the window, so you can spot your busy and slow seasons. A month with no jobs still gets its slot, so a quiet month shows up as quiet instead of disappearing. On All time, the chart goes back three years at most.
By status
The By status table lists each job status with:
- Jobs: how many jobs are in that status.
- Share: that count as a percent of all jobs created in the window.
- Value: the combined job totals.
It's sorted with the busiest status first.
By job type
The By job type table breaks the same jobs down by job type, with Jobs, Value and Avg / job for each. Jobs with no type set are grouped as No type. This is a quick way to see which kinds of work you do most and which ones are worth the most per job.
Top cities
The Top cities table shows your 10 busiest cities by number of jobs, with the Jobs and Value for each. It reads the city and state from the job's address, so it only shows up once your jobs have them.
Where to look for money and sources
Job Statistics doesn't split work out by team member, and it doesn't show the payments you collected. For those:
- The Sales report covers revenue.
- The ROAS report shows where your customers come from and what each source earns you.
Related articles
- Finding your reports and who can see them
- Understanding the Jobs report
- Understanding the Leads report
- How to add job types
- Tracking where your customers come from