In this article, you'll learn how to read two charts in your Website report: Organic positions, which shows how many Google searches your site shows up for and how high, and SERP features, which shows the special spots on Google your site has won. They're the quickest way to see whether your rankings are moving the right way.
To open the charts:
- In the dashboard menu, click Reports.
- Click Website.
- If you have microsites, click the site you want in the row of tabs at the top. Your main site is first.
- Scroll past Visitors and Performance. Organic positions comes next, and SERP features is a little further down, under Top organic competitors.
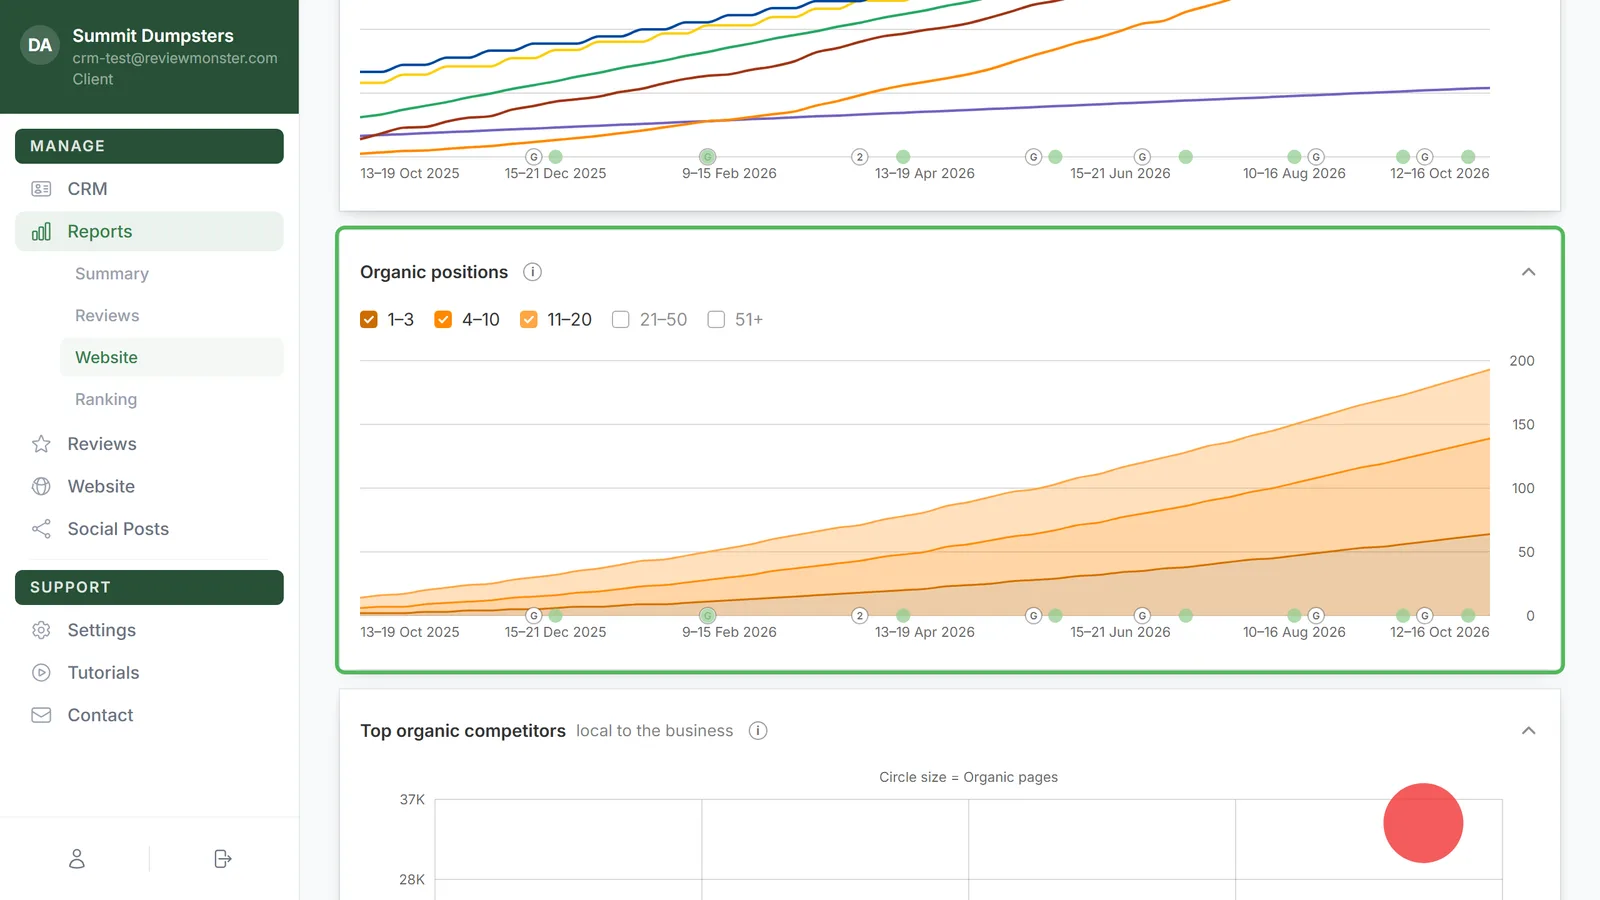
Reading the Organic positions chart
Each colored band counts the searches your site ranks for in one range of Google positions:
- 1–3: the top three results
- 4–10: the rest of page one
- 11–20: page two
- 21–50: pages three to five
- 51+: further back than that
The bands are stacked, so the top edge of the chart is the total of every band you have switched on. 1–3, 4–10 and 11–20 are on when the page opens. 21–50 and 51+ start off.
Choosing which bands to show
- Click a band's name above the chart to turn it on or off. A colored box means it's showing. A white box means it's hidden.
- To change the time span, use the date menu above Performance (it starts on Last year) and the Weekly or Monthly menu next to it. Those two menus apply to every chart on the page.
Seeing the numbers for one week
Hover over the chart. A card shows the date, then All positions, the total for that week, then the count in each band. All positions only adds up the bands you have switched on, so turn on 21–50 and 51+ if you want the full count.
Reading the SERP features chart
SERP features are the extra spots on Google's results page beyond the normal blue links. This chart draws one line per feature, counting how many searches give your site that spot. The Owned menu in the corner is the only view right now: it counts features your site owns, not ones that just show up on the page.
All twelve features are switched on when the page opens. Click a name to hide or show its line. Hover the small (i) after a name for a one-line explanation. In short:
- Featured snippet: Google answers a question in a box above the normal results, and the answer comes from your site.
- AI Overview: Google's AI summary at the top of the page links to your site as a source.
- Sitelinks: extra links under your listing to other pages on your site, like Services or Contact.
- Top stories: one of the recent news articles near the top is yours.
- Image pack: one of the pictures in the row of images comes from your site.
- Videos: a video in the results is yours.
- Discussions and forums: a forum or community post in the results links to your site.
- X (Twitter): a row of recent posts from X shown in the results.
- Knowledge panel: the info card on the right with hours, photos and a map is for your business.
- Thumbnail: a small picture next to your normal result.
- People also ask: one of the answers in the expandable questions list comes from your site.
- Local pack: the map with three nearby businesses, for searches like "junk removal near me", and you're one of the three.
How to read a rise or a fall
- The whole stack grows. Your site is showing up for more searches. That's usually new pages and blog posts getting picked up.
- Bands shift upward. If 11–20 shrinks while 4–10 or 1–3 grows by about the same amount, pages are moving from page two onto page one. That's the change that brings calls.
- The stack shrinks. Some searches dropped out. Check what's sitting on the baseline under that week.
- A SERP feature line climbs. You're winning that spot on more searches. A rising Local pack line is one of the best signs for a local business.
- A SERP feature line drops. You lost the spot on some searches, often to a competitor or after Google changed what it shows.
Markers along the bottom of both charts help explain a jump. A G marks a Google ranking update. Hover it for what the update was. A green dot marks changes made to your site, sized by how much changed. Hover it and click View changes to see the list.
Related articles
- Reading the Website report
- Reports in your dashboard: an overview
- Picking the five searches you want to win
- Understanding your microsites
- Understanding Auto-Blog posts