In this article, you'll learn how to read the Estimates report: what the tiles at the top mean, how the two tables break things down, and how to use it to follow up on quotes. It's the fastest way to see how many of your estimates turn into paying work, and which customers looked at a quote but never said yes.
The Estimates report is on the web CRM. It isn't in the phone app.
To open the Estimates report:
- In the menu, click Reports.
- Click the Estimates tile.
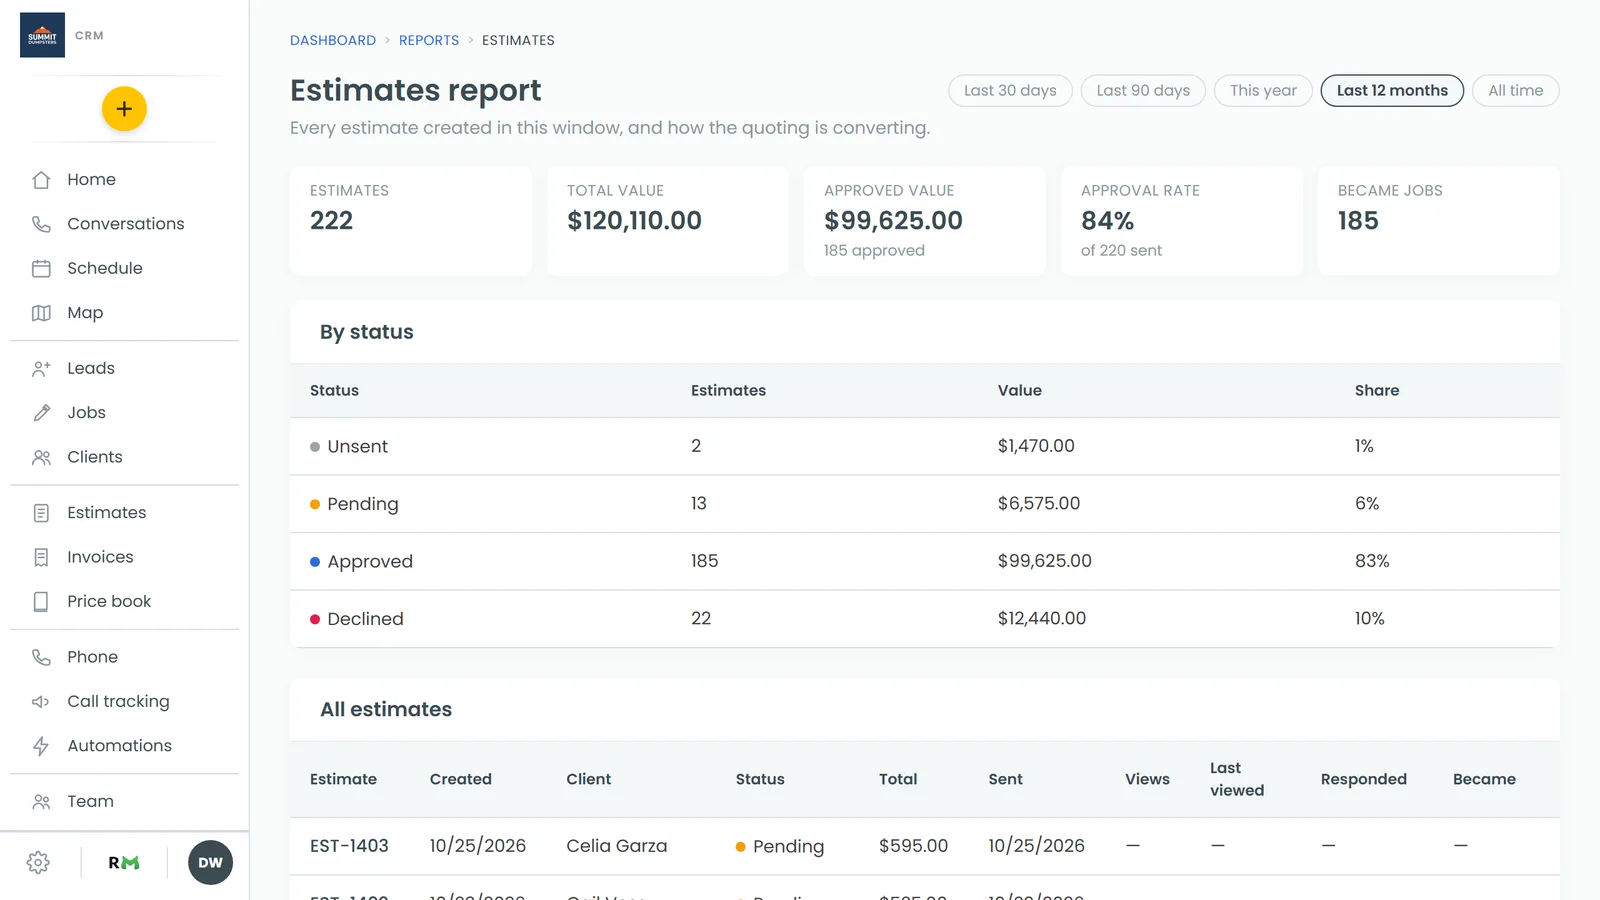
Picking the date range
The pills at the top right decide which estimates the report counts. It goes by the date each estimate was created, so an estimate made last year and approved this week falls under last year.
- Click one of Last 30 days, Last 90 days, This year, Last 12 months or All time.
- The whole page, tiles and both tables, updates to that window.
The report opens on Last 12 months.
The tiles at the top
- Estimates is how many estimates were created in the window.
- Total value adds up the totals of all of them, whatever their status.
- Approved value adds up the estimates that are Approved or Won. The line under it says how many that is, for example "4 approved".
- Approval rate is approved estimates out of the ones you sent. Estimates still sitting at Unsent aren't counted, so a pile of drafts doesn't drag the number down. The line under it shows how many were sent, like "of 12 sent".
- Became jobs is how many of those estimates were turned into a job.
The By status table
This rolls the window up into one row per status: Unsent, Pending, Approved, Won, Declined and Archived, in that order. Only statuses you actually have show up. Each row has:
- Status
- Estimates, the count
- Value, the total of those estimates
- Share, that status's slice of all the estimates in the window
It's a quick way to see where quotes are stalling. A big Pending row means a lot of money is waiting on a decision.
The All estimates table
Below that is every estimate in the window, newest first. The columns are:
- Estimate, the estimate number
- Created
- Client
- Status
- Total
- Sent, the date it went out (a dash if it hasn't)
- Views, how many times the customer opened the estimate link you sent them
- Last viewed, the date and time of the most recent open
- Responded, the date the customer approved or declined
- Became, the job number it turned into. Click it to open the job.
Following up on estimates that were viewed
The Views and Last viewed columns only fill in when a customer opens the estimate from the link in your text or email. Look for rows that have views but no Responded date. Those are people who've read your quote and gone quiet, which makes them the best ones to call or text first.
For more on how views are tracked, see How to know when a customer has viewed an estimate.
Related articles
- Finding your reports and who can see them
- How to know when a customer has viewed an estimate
- Managing estimates from the Estimates page
- How to update estimate statuses
- Understanding your invoices report